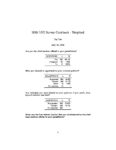
Data from the Ohio Secretary of State as of 11/2/2012
Democratic Early Voting in Florida
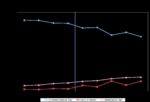
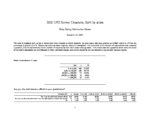
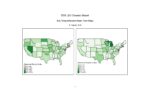
Early Voting from 1996-2012
Source: Current Population Survey Voting and Registration Supplement
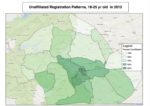
Map of Senate District 11
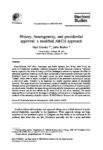
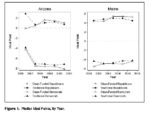
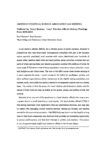
Figure 3 from Bentele and O’Brien
Courtesy of Political Analysis, Oxford University Press
Courtesy of Oxford University Press
Courtesy of California Civic Education Project (regionalchange.ucdavis.edu)
Figure 1: National CPS data on early and absentee voters as percentage of all voters (data only available up until 2006, figure from Gronke, McDonald, 2008).
Figure 3. Pre-Election Day turnout during presidential election in NC since 2000 (data from NCSBE).
Figure 2: Predicted pre-Election Day 2014 turnout in NC, using only midterm results (data from NCSBE).
Figure 4. Predicted pre-Election Day turnout in NC, using midterm results and ceiling hypothesis (data from NCSBE).
Figure 1
Figure 1
Hagan / Tillis votes in Watauga County, NC
Courtesy of State Politics and Policy Quarterly
Courtesy: US Elections Project
Data: 2014 CCES
Source: 2014 CCES
Source: 2010 CCES
Source: 2010 CCES
Image courtesy of the National Conference of State Legislatures (http://www.ncsl.org/research/elections-and-campaigns/absentee-and-early-voting.aspx)